Infrastructure & Service Topology
1. Service Map – End-to-End Calls
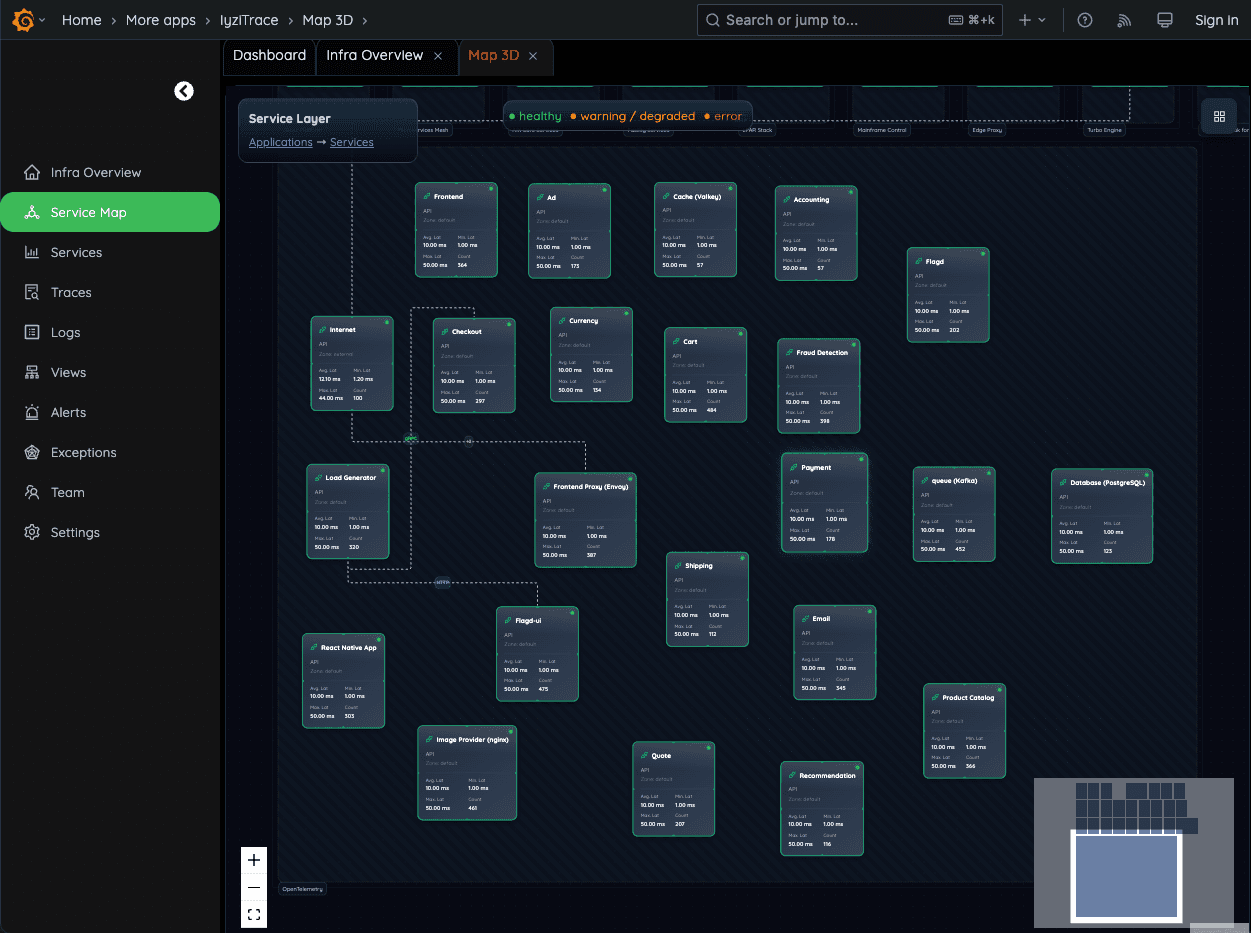
View every API and backend service as a connected map. Follow request paths across microservices and understand how each dependency affects overall performance.
- Visual representation of all services
- Interactive dependency graph
- Real-time call flow visualization
- Identify bottlenecks at a glance
2. Full Service Dependency Graph
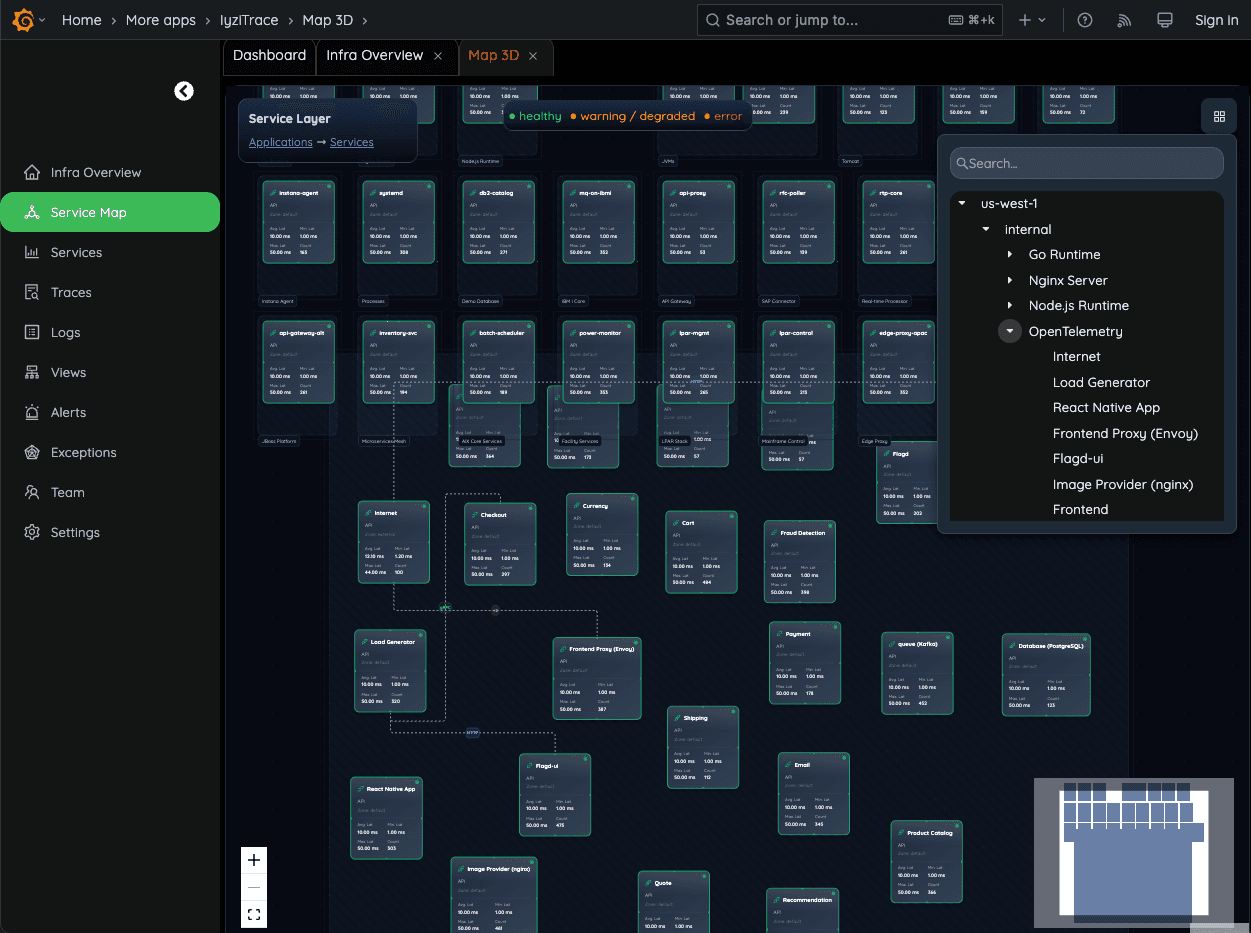
Visualize every microservice in your system and how they interact. Expand, search, or drill into any node to understand dependencies, bottlenecks, or upstream/downstream risks.
- Complete system topology
- Interactive node exploration
- Dependency impact analysis
- Upstream/downstream tracing
3. Visual Call Flows
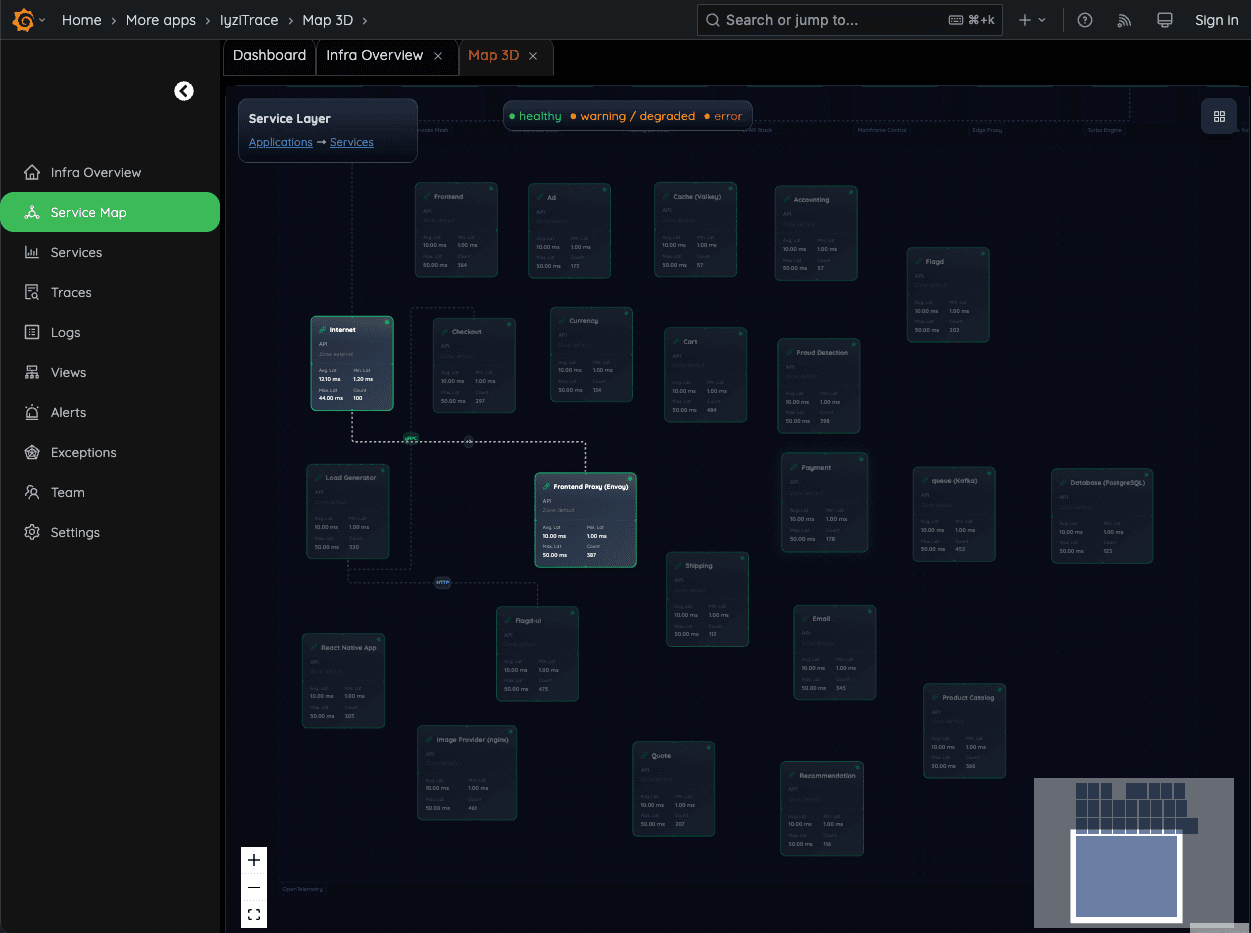
Follow the exact path of a request across services – from the edge to the core and back. IyziTrace turns complex microservice flows into an easy-to-read visual journey.
- Request path visualization
- Service interaction timeline
- Cross-service tracing
- Easy-to-understand flow diagrams